Data Visualization Architect | Power BI Developer | Microsoft Fabric Engineer| Business Intelligence Analytics
Hi. My name is Daniel and I’m deeply passionate when it comes to crafting cohesive front end user interfaces and thoughtfully developed user experiences.
But more than simply making beautiful things, I want my work to have measurable impact on business outcomes. I frequently incorporate UI/UX best practice principles into my design process. I am an avid user of the Microsoft Fabric unified platform to ensure excellence in every aspect of the reporting application development life cycle.
I love collaborating with others and I aspire to always remain customer centric, ensuring that the final product is both polished in form and function, but ultimately delivers the truth.
Every screen shot in the following pages are taken from versions of dashboards I have designed, built, and deployed in a real customer setting - and I’m proud and honored to present to you these use case studies and hopefully, if the opportunity allows, a chance for you and I to create something together.
Case Study: Banner Health Network
Banner Health Network is comprised of 5,000 Banner Health-affiliated physicians and advanced practice providers, 15 Phoenix-area Banner Health hospitals, 8 health centers and a variety of other medical facilities. Parent company, Banner Health, is one of the largest nonprofit health systems in the country. For more information go to www.BannerHealth.com.
For a massive undertaking like this, one of the important principles to grab ahold of was the idea of End User Aawareness. Who is my audience? The design language will be different depending on who will be consuming the build. Are these summary views for the C-Suite or are these Encounter Distributions for Operational Staff? Will the usage format be Live Dashboards or simply screen shot exports to a PowerPoint presentation? These are just a few of the considerations taken during the design and build process.
MPORTANT NOTE: Please note that names, logos, places, and displayed values have been changed to protect the nature of the client engagement and to satisfy HIPPA compliant regulatory requirements. These examples have been modified from their original versions and are being utilized here for demonstration/mock-up purposes ONLY.
Case Study: CVS Aetna Patient Saftey
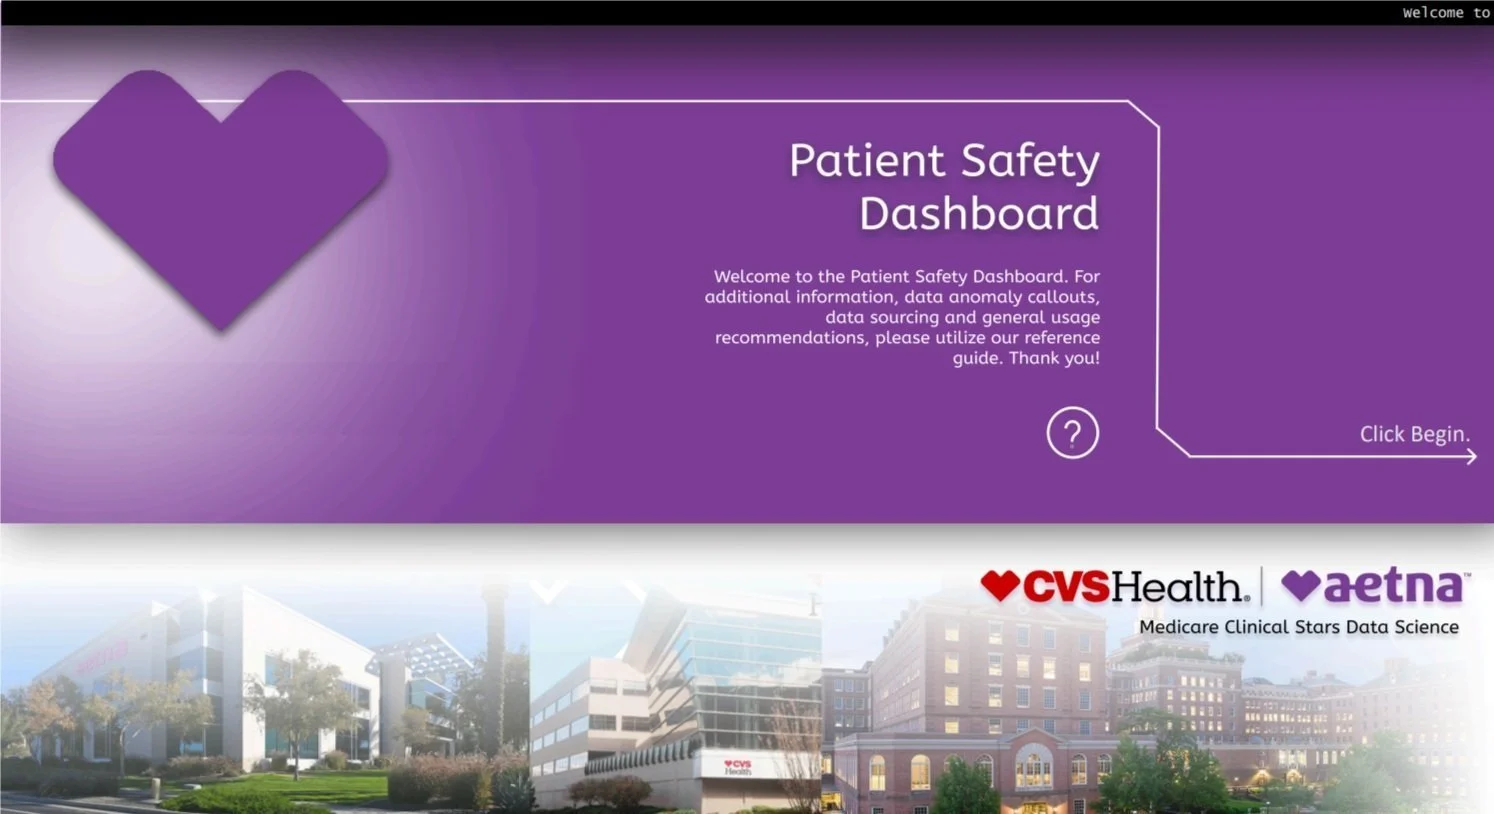
CSV Aetna serves a network of over 700,000 members and collaborates with thousands of healthcare providers nationwide. They process approximately 1.5 million claims annually, supporting a system that impacts millions of patients and stakeholders each year.
Projects like this dashboard demand seamless integration of intricate data and user-focused design. While complexity can creep in, the best solutions often lie in simplicity. This Patient Safety Dashboard, featuring interactive filters for contracts, year measures, and patient safety metrics, displays critical data through clear, actionable visualizations—such as bar charts tracking statin use in persons with diabetes (e.g., H0523, H0528, H1109) across multiple reporting months from 2023 to 2024. It also includes performance metrics by contract, adherence rates, and industry comparisons, all presented in an intuitive layout with sections like "All Trends," "Safety Measure Distributions," and "Deep Dive Analysis." A build packed with features and data like this requires careful resource planning to ensure long-term efficiency. Balancing functionality with sustainability is a guiding principle woven into every stage of development.
IMPORTANT NOTE: Please note that names, logos, places, and displayed values have been changed to protect the nature of the client engagement and to satisfy HIPPA compliant regulatory requirements. These examples have been modified from their original versions and utilized here for demonstration/mock-up purposes ONLY.
Principles of Visualization Theory
Case Study: RWJ Barnabus Care Management
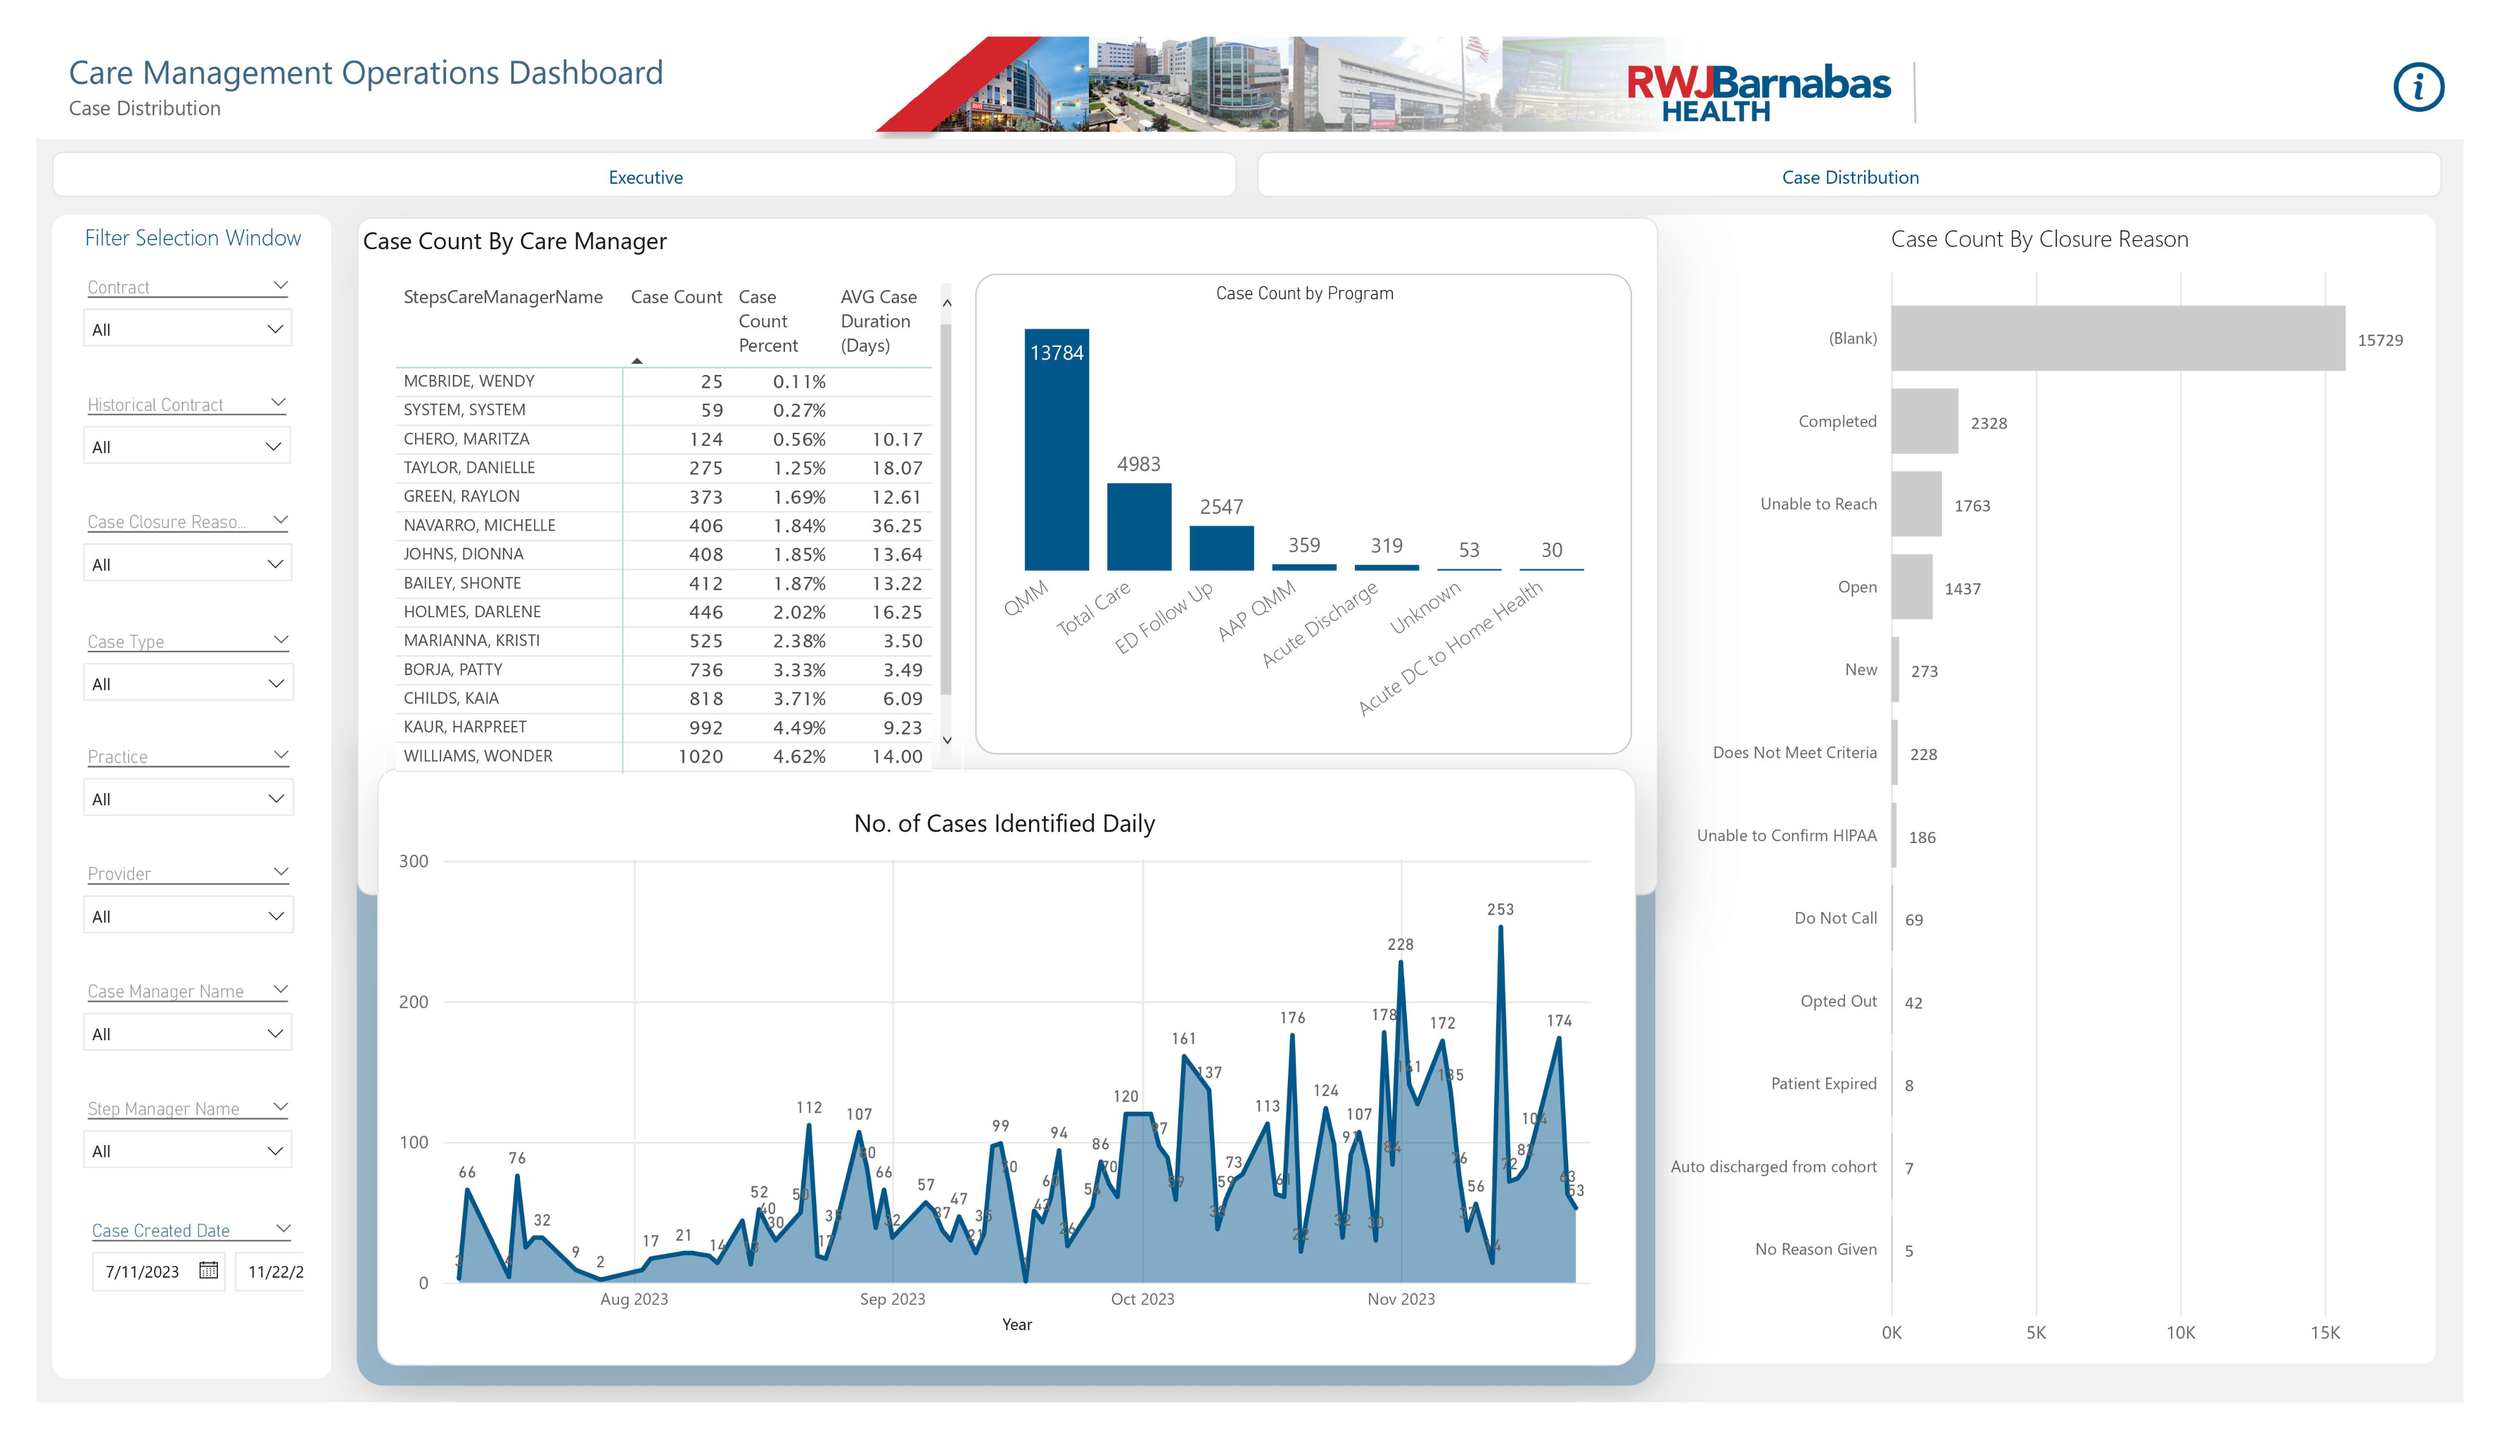
RWJ Barnabus Health has 9,000 active physicians with a total staff of 41,000 employes. They average around 283,000 admissions and same day surgery patients per year. Across their entire system, they treat over 3 million patients per year.
Many projects such as this one require many moving parts and pieces. It becomes easy to implement complex logic. But more often than not, the most elegant solutions are the simplest. The more content, components, and functionality a build has, the more resources it will take to keep servicing it for the long haul. We need to have the courage to keep this trade-off in mind at all segments of the development process.
MPORTANT NOTE: Please note that names, logos, places, and displayed values have been changed to protect the nature of the client engagement and to satisfy HIPPA compliant regulatory requirements. These examples have been modified from their original versions and are being utilized here for demonstration/mock-up purposes ONLY.
Case Study: Milliman
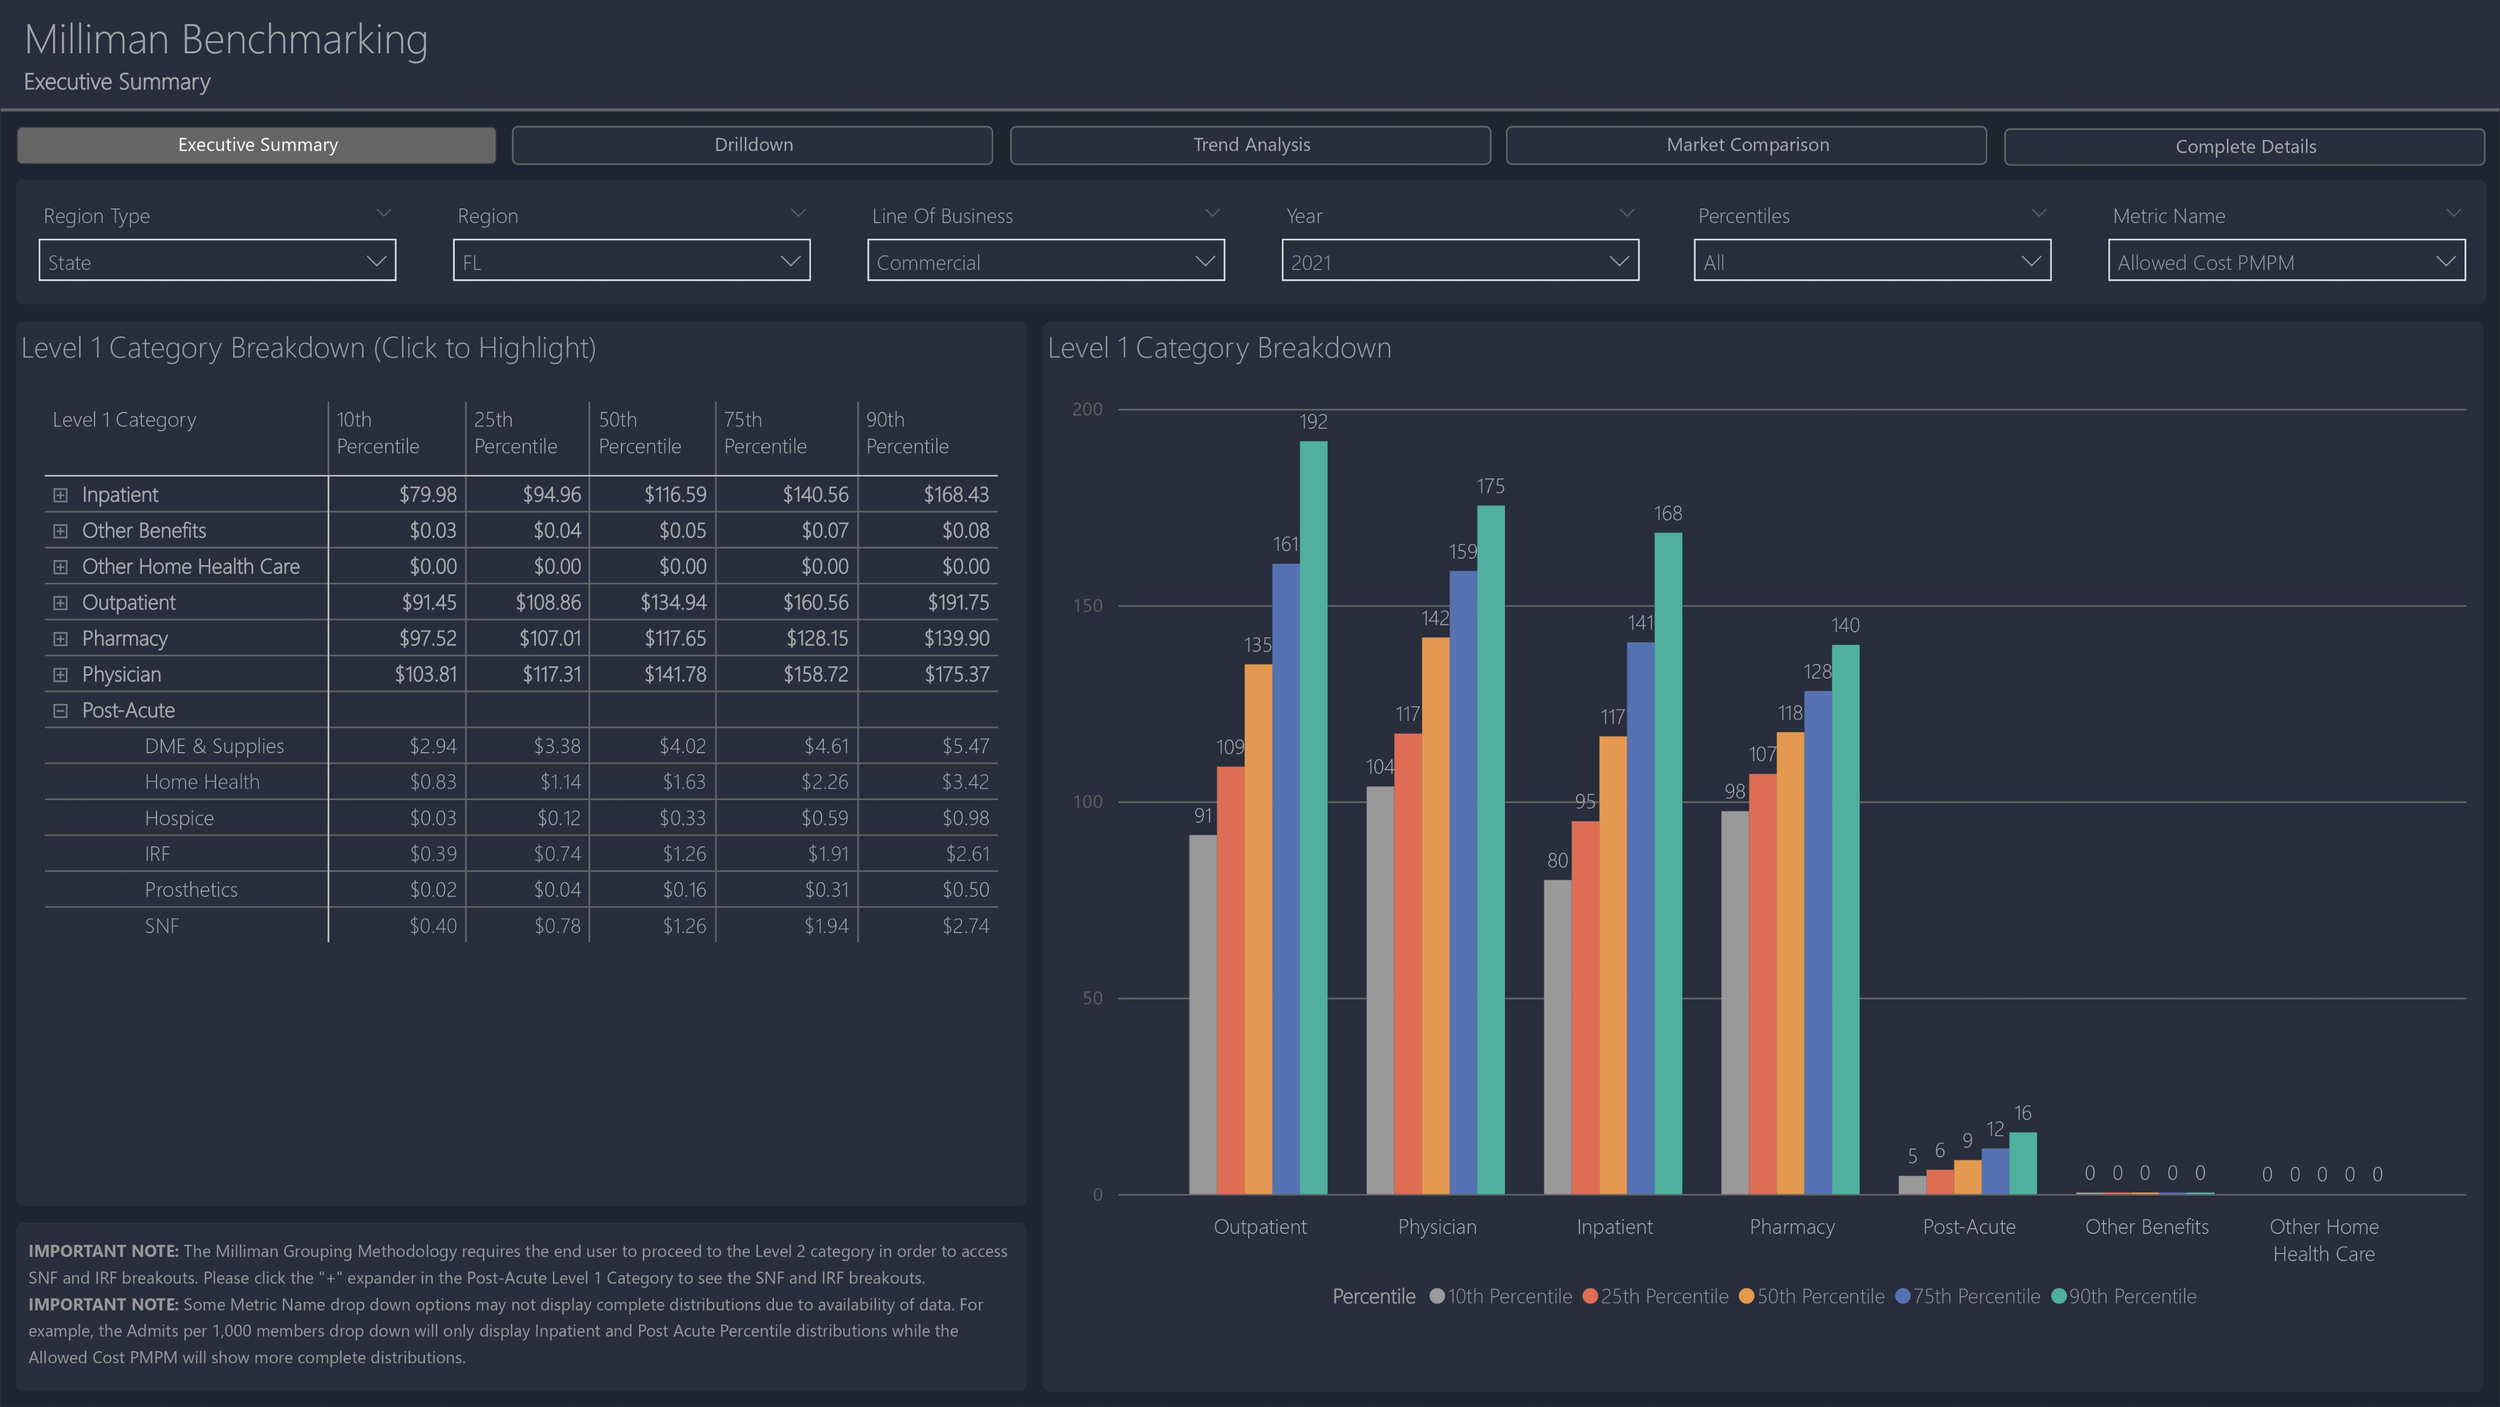
Milliman is an international consulting and actuarial firm that offers a range of services in the fields of insurance, healthcare, retirement, and financial risk management. In this context, we partnered with Milliman to provide us healthcare benchmarking data sets so that our clients could compare their performance against their peers.
Sometimes, it is the case that when the data surfaces, it reveals truths that we weren’t ready to hear. And these realities guide decision makers to make tough choices in order to achieve positive business outcomes. We have an ethical imperative to always tell the truth. It is our responsibility to never manipulate the data in any way. We make a concerted effort to never mask data elements in components, or leave out certain aspects in order to bias the end user toward a particular conclusion.
IMPORTANT NOTE: Please note that names, logos, places, and displayed values have been changed to protect the nature of the client engagement and to satisfy HIPPA compliant regulatory requirements. These examples have been modified from their original versions and utilized here for demonstration/mock-up purposes ONLY.
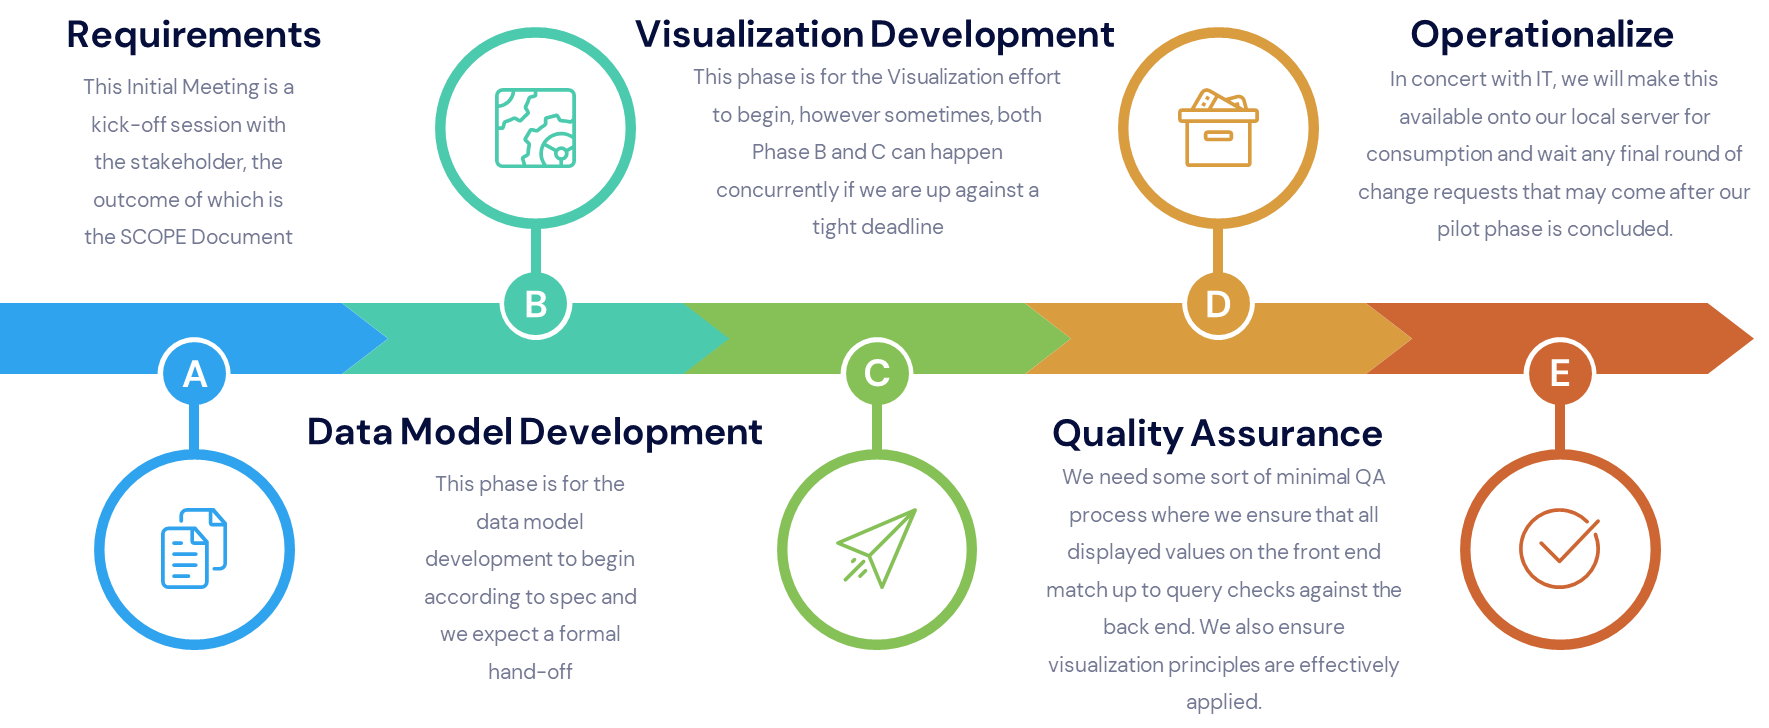
Project Dev Cycle
If You Can Dream It, You Can Build It
:)
If You Can Dream It, You Can Build It :)


